Unmasked: Analytics provide new evaluation tools
By Kevin Woodley – NHL.com Correspondent
Analytics and advanced statistics have boomed in popularity across the NHL during the past couple seasons, with more and more stories either dedicated to or including shot-based numbers such as Corsi and Fenwick as indicators of puck possession as well as predictors of success for teams and players.
So what about the goaltenders? Are there metrics suitable for evaluating them?
In a perfect world there would be some kind of goaltender rating which factors in everything, similar to the quarterback rating used in the NFL.
In reality, as Columbus Blue Jackets goaltending coach Ian Clark once explained, the position may be too dynamic for one definitive statistical measure because there are so many outside variables which can affect each goalie’s statistical performance.
“Goalies react to the hand dealt to them; they don’t get to control play,” Clark said. “Unlike a quarterback or a pitcher, who gets to control and dictate the play, goaltenders are recipients of the play, and as such there is a huge impact on how the team plays in front of them and statistical outcomes.
“Sergei Bobrovsky, Henrik Lundqvist and Tuukka Rask all face completely different things and have no control over it, whereas Peyton Manning controls what is going on over his playing surface when he lines up behind the ball. That affects statistics, and that is one of the reasons goaltending is a bit of an anomaly when it comes to using pure numbers.”
UNMASKED

‘Bob’, Mason succeeding differently
By Kevin Woodley – NHL.com Correspondent
The Columbus Blue Jackets’ Seregi Bobrovsky and the Philadelphia Flyers’ Steve Mason always will be linked, but are succeeding in different ways. READ MORE ›
Goaltending does not exist in a vacuum. Team play is a part of every goalie’s success, and the biggest factor in success is the quality of shots faced.Traditional statistics treat every shot the same, but you don’t have to be a goalie to know there’s a difference between an unscreened wrist shot from the point, a one-timer in the slot, and a backdoor tap-in.
Quantifying the differences is key. Some newer goaltending statistics try to factor in quality using shot distance or by grading shots from within a “home plate” area in front of the net, but former New York Rangers goalie Steve Valiquette doesn’t think it’s enough.
“It’s not about location, it’s not about distance from net, forget all that,” Valiquette said. “It’s about the sequence.”
Valiquette, who is coaching goalies and working as an analyst for MSG Network, has been studying goals for four years, including every one scored in the NHL this season, and breaks them down into two categories: Green Goals, which are scored off high-percentage shots, or shots that the goaltender has less than half a second to see, and Red Goals, which come off low-percentage shots.
Among Valiquette’s qualifiers for Green Shots are the usual factors like deflections, one-timers, screens, broken plays and rebounds. But Valiquette has identified another key factor in shot quality: Plays and passes which move across what he calls the “Royal Road,” a line that halves the offensive zone in two below the tops of the faceoff circles.
Valiquette said 76 percent of goals in the NHL this season have been scored off Green Shots, including 30 percent on plays that involved either a pass or possession moving across the Royal Road.
That should come as no surprise to anyone who has followed Chris Boyle’s Shot Quality Project on the Sportsnet.ca website. With more than 50,000 shots tracked individually, Boyle has identified numerous trends, establishing expected save percentages for clean shots, rebounds, deflections and, toughest of all, transition shots, which come off plays which force the goaltender to move laterally and reset.
Boyle has calculated the expected save percentage on a clean shot to be .949, but it’s .651 on shots immediately following a pass. From the goalie’s perspective, any play which forces a change in angle and depth increases the difficulty on the save. Factor in differences in the number of these chances each team gives up, and you get an indication of how shot quality can affect a goalie’s statistics.
Unfortunately Boyle’s and Valiquette’s projects are limited by their time. There is no database, at least not one available to the public, tracking every shot in the NHL with that kind of detail.
Programs like the 360 Save Review System software from Double Blue Sports Analytics should make it a lot easier to track shot-quality detail in the near future. In January, the company will release a version which adds customizable shot attributes to its tracking features.
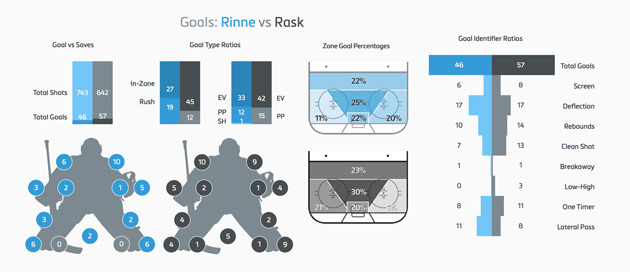
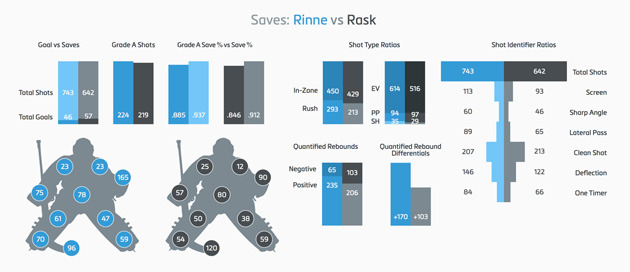
The company used the new software for a comparative breakdown of early season Vezina Trophy favorite Pekka Rinne and reigning Vezina winner Tuukka Rask, including breakdowns of the types of shots they were seeing, their save percentages on Grade A shots inside “home plate,” and where exactly they were making saves and getting beat.
Not surprisingly, Rinne, whose active glove has been discussed in this space, has caught a whopping 165 shots this season.
The new Double Blue breakdowns even include rebound qualifiers, but like Boyle and Valiquette’s projects, they are limited in scope.
So what statistics can we use to assess every goalie?
Wins, though obviously important, are influenced heavily by the team’s performance. Goals-against average is imperfect for similar reasons. Among the traditional statistics, save percentage is regarded as most telling, and even then most prefer to focus on even-strength save percentage because of the small sample size and resulting randomness in penalty-killing save percentage.
There are, however, other metrics being used to paint a more complete comparative picture among NHL goaltenders. As the season enters its middle third, it’s interesting to see where the NHL save percentage leaders stack up in the other categories.
| Top goalies by save percentage (min 10 GP) (and how their other statistics stack up) | |||||
| Goalie | SV% | EV SV% | QS% | GSAA | AEVSV% |
| Pekka Rinne | .937 | .946 (3) | .875 (1) | 17.05 (1) | .9383 |
| Michael Hutchinson | .937 | .951 (2) | .625 (12) | 6.15 (8) | .9495 |
| Brian Elliott | .931 | .952 (1) | .750 (3) | 6.09 (9) | .9477 |
| Corey Crawford | .929 | .932 (13) | .778 (2) | 7.11 (5) | .9363 |
| Marc-Andre Fleury | .927 | .932 (12) | .650 (8) | 8.61 (3) | .9364 |
| Calvin Pickard | .927 | .939 (4) | .714 (4) | 4.03 (11) | .9377 |
| Jonathan Quick | .926 | .937 (5) | .636 (11) | 11.66 (2) | .9368 |
| Craig Anderson | .925 | .933 (10) | .471 (32) | 7.24 (4) | .9319 |
| Roberto Luongo | .925 | .937 (6) | .619 (13th) | 6.57 (6th) | .9291 |
| Carey Price | .923 | .930 (16) | .520 (26) | 6.30 (7) | .9283 |
Quality starts
This statistic was developed by Robert Vollman, author of the Hockey Abstract series of books devoted to statistical analysis in hockey. He defined a quality start (QS) as a game when the goalie stops more than the median save percentage for the League (currently .917) or gives up less than three goals while stopping .885 or more of shots faced.
Looking at quality starts on hockey-reference.com so far this season, most of the top save-percentage goalies are at the top of the list, led by Rinne, who posted quality starts in 21 of his first 26 games to lead the League by a wide margin at 87.5 percent. Most surprising was Carey Price of the Montreal Canadiens well down the list at 52 percent with quality starts in 13 of 25 games, ahead of only Craig Anderson of the Ottawa Senators (47.1 percent) among the save percentage leaders. Perhaps most telling, however, are comparisons between teammates, with Michael Hutchinson (62.5 percent) one spot ahead of the often criticized Ondrej Pavelec (61.9 percent) in the Winnipeg Jets crease, and Alex Stalock (85.7 percent) well ahead of Antti Niemi (57.1 percent) and perhaps deserving of more starts with the San Jose Sharks now that he is healthy again.
| Quality Start Percentage | |||
| QS% Rank | Goalie | QS% | SV% Rank |
| 1 | Pekka Rinne | .875 | 1 |
| 2 | Corey Crawford | .778 | 4 |
| 3 | Brian Elliott | .750 | 3 |
| 4 | Calvin Pickard | .714 | 6 |
| … | … | … | … |
| 8 | Marc-Andre Fleury | .650 | 5 |
| … | … | … | … |
| 11 | Jonathan Quick | .636 | 7 |
| 12 | Michael Hutchinson | .625 | 2 |
| 13 | Roberto Luongo | .619 | 9 |
| … | … | … | … |
| 26 | Carey Price | .520 | 10 |
| … | … | … | … |
| 32 | Craig Anderson | .471 | 8 |
Goals Saved Above Average
Another relatively new comparative goaltending statistic available at hockey-reference.com, Goals Saved Above Average (GSAA) is essentially a plus-minus for goalies compared to the NHL average. In other words, how many goals has a goaltender saved compared to an average goalie facing the same workload. Or, in the case of a negative number, how many more goals has he surrendered. Though GSAA includes penalty-killing, tends to favor higher workloads, and might be better expressed as a per-game average, it’s interesting to see where some of the top goaltenders rank.
Rinne is at the top of the list by a wide margin at 17.05 Goals Saved Above Average, well ahead of Jonathan Quick of the Los Angeles Kings (11.66) in second place and Marc-Andre Fleury of the Pittsburgh Penguins (8.61) in third. At the other end of the spectrum is Ryan Miller, who in his first year with the Vancouver Canucks was at -7.82, meaning he’d given up almost eight goals more than expected from a League average goaltender despite still being top-five in the NHL with 16 wins in his first 23 starts.
| Goals Saved Above Average | |||
| GSAA RANK | Goalie | GSAA | SV% Rank |
| 1 | Pekka Rinne | 17.05 | 1 |
| 2 | Jonathan Quick | 11.66 | 7 |
| 3 | Marc-Andre Fleury | 8.61 | 5 |
| 4 | Craig Anderson | 7.24 | 8 |
| 5 | Corey Crawford | 7.11 | 4 |
| 6 | Roberto Luongo | 6.57 | 9 |
| 7 | Carey Price | 6.30 | 10 |
| 8 | Michael Hutchinson | 6.15 | 2 |
| 9 | Brian Elliott | 6.09 | 3 |
| … | … | … | … |
| 11 | Calvin Pickard | 4.03 | 6 |
Adjusted Save Percentage
The above-mentioned statistics treat all shots equally, and any goaltender at any level can tell you that’s not the case. At war-on-ice.com they have introduced Adjusted Save Percentage (ASV%), which weights a goalie’s save percentage based on the distance of the shot faced. Simply put, the closer the shot, the more likely it is to go in. By factoring distance into each shot, the ASV% provides an additional layer of context about the quality of shots faced by each goaltender. If a goalie’s ASV% is lower than their standard save percentage, it should indicate the mainstream number is slightly inflated because he faces easier shots. Conversely, a higher ASV% indicates he is facing tougher shots, at least based on distance.
The differences aren’t large and we’ve already established the limits of distance as a shot-quality qualifier, but the results are interesting, especially when it comes to playing behind teams perceived to be either good or bad defensively. Among the top-10 save percentage leaders, only Fleury and Corey Crawford had higher adjusted save percentages at even strength, which might surprise some given the Chicago Blackhawks‘ reputation for being stingy defensively.
| Even Strength Save Percentage (compared to Adjusted) | |||
| EV SV% RANK | Goalie | EV SV% | AEVSV% |
| 1 | Brian Elliott | .952 | .9477 |
| 2 | Michael Hutchinson | .951 | .9495 |
| 3 | Pekka Rinne | .946 | .9383 |
| 4 | Calvin Pickard | .939 | .9377 |
| 5 | Jonathan Quick | .937 | .9368 |
| 6 | Roberto Luongo | .937 | .9291 |
| … | … | … | … |
| 10 | Craig Anderson | .933 | .9319 |
| … | … | … | … |
| 12 | Marc-Andre Fleury | .932 | .9364 |
| 13 | Corey Crawford | .932 | .9363 |
| … | … | … | … |
| 16 | Carey Price | .930 | .9283 |
None of these statistics is perfect, and even if we get to a point where shot quality can be tracked and analyzed for every goalie, there are other unique factors which will determine individual success.
Most possession analytics assume quantity is good for shooters and bad for goaltenders. But not every goalie is comfortable with a light workload. There is such a thing as a good “busy” goalie.
“Ask every goalie in the NHL whether they would rather have 35 or 15 shots and they’ll all choose 35,” Valiquette said with a laugh.
The idea that fewer shots are more difficult may be ever more difficult to quantify. For now, though, the focus is on shot quality.


